

Decoding NeoCloud: A Practical Guide for Investors
How to Read the Financial Reports of IREN, Nebius and CoreWeave: A Simple Breakdown of Key Metrics

Understanding financial reports in the NeoCloud sector can be tricky because the industry blends traditional data-center economics with fast-moving AI demand. Companies report metrics like ARR, contracted power, and MW deployed, but not all of them mean what new investors assume they mean.
The goal of this post is to give a simple framework for reading these reports correctly, without overreacting to headline numbers or overlooking the signals that actually matter for long term growth.
ARR ≠ REVENUE
One of the most common sources of confusion is the relationship between ARR and actual revenue. NeoCloud companies often highlight ARR because it captures the current run-rate of the business, especially when infrastructure ramps quickly. But ARR isn’t a forecast and it isn’t the same as annual revenue. It’s simply a snapshot of how fast the business is running right now. A good example is Nebius, let’s take a look at the letter to shareholders, Q3’25
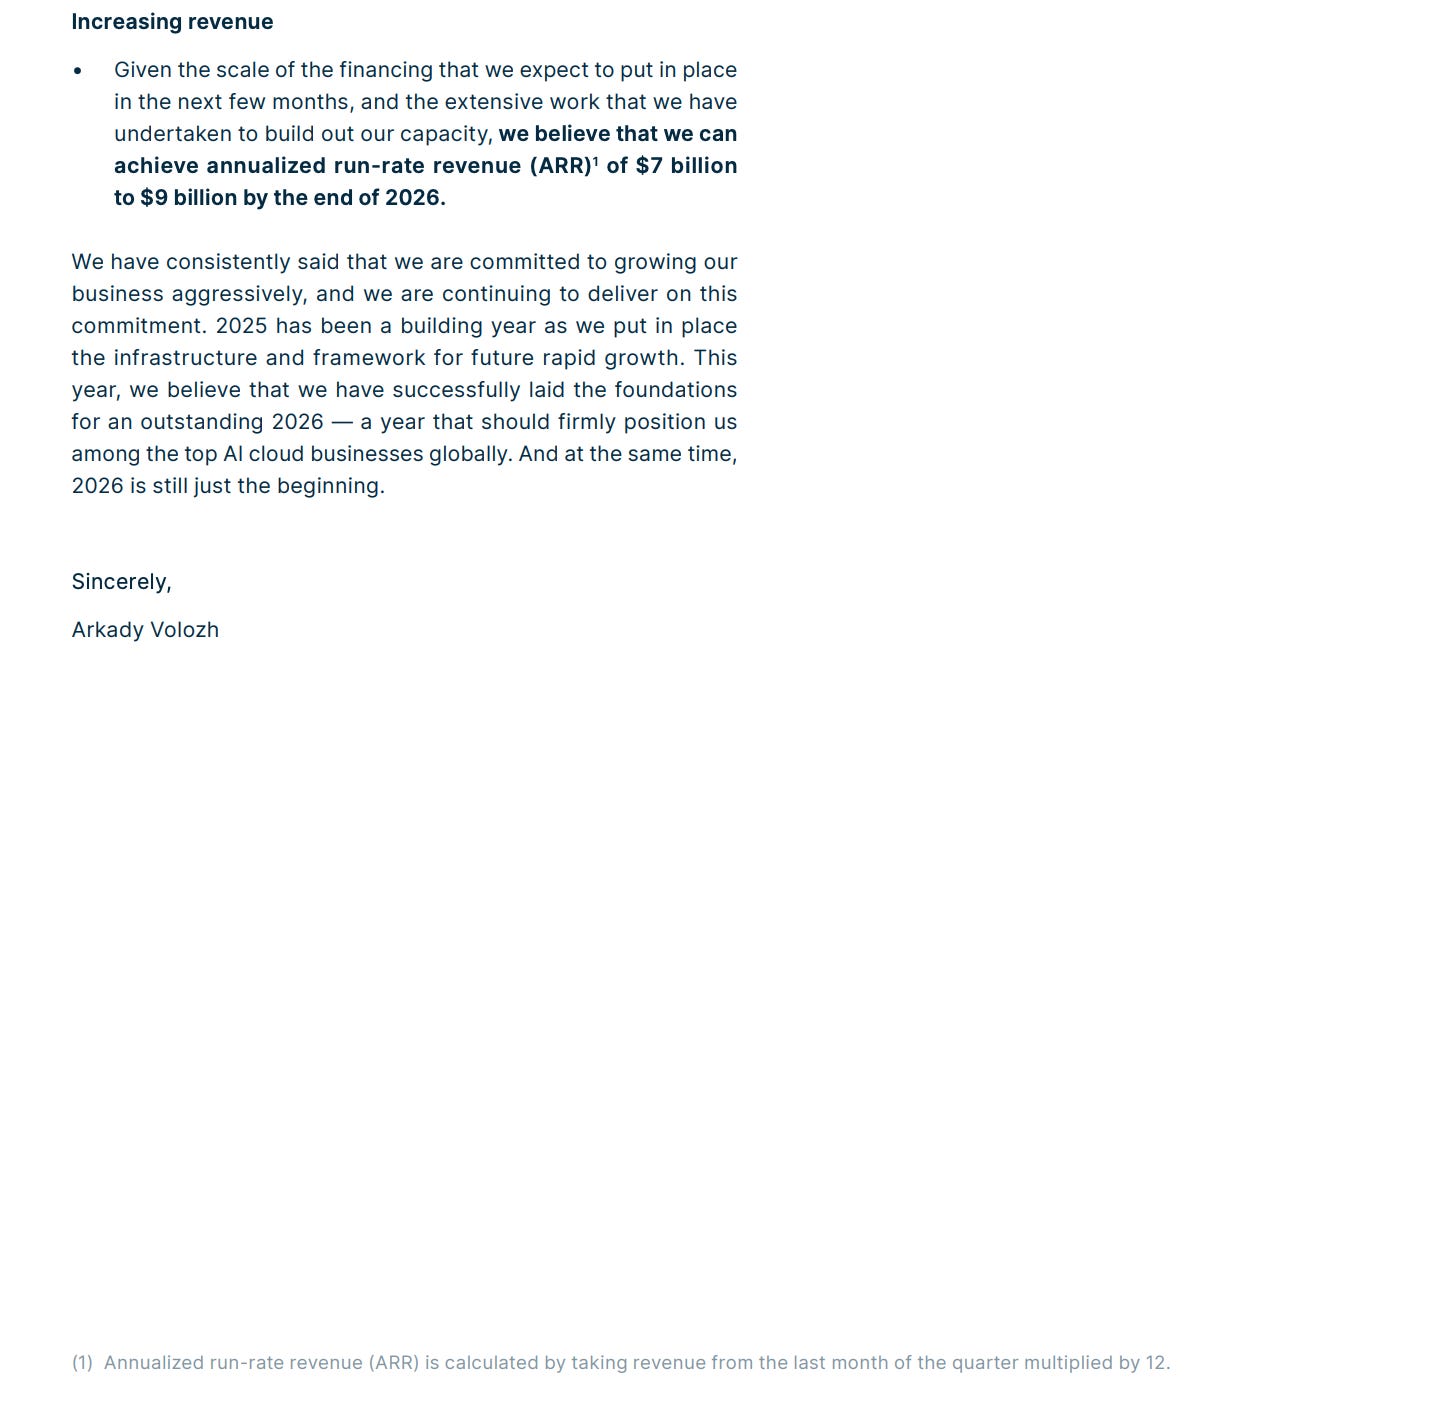
Nebius explains this clearly in the footnote:
“Annualized run-rate revenue (ARR) is calculated by taking revenue from the last month of the quarter multiplied by 12.”
This matters because ARR is not a forecast and not a measure of cash earned. It simply annualizes the most recent monthly pace. If revenue in the final month of a quarter accelerates, for example due to new capacity coming online, ARR will jump immediately, even though the full infrastructure may not be operating at that level yet.
In other words, ARR shows momentum, while revenue shows results.
Treat ARR as a signal of operating speed, not a prediction. The real test is whether quarterly revenue starts catching up to the ARR trend over time. When both move in the same direction, the business is scaling in a healthy, sustainable way.

Understanding MW cost: the simplest way to estimate CapEx
For NeoCloud companies, the cost per MW is one of the most important metrics. Investors use it as a quick way to estimate total project CapEx, compare business models, and understand how efficiently each company can scale. If you know how much one MW costs to build, you can immediately approximate the budget for a 50MW or 100MW expansion and compare it across providers.
MW cost is an all-in number
It reflects everything required to deliver one usable, AI-ready megawatt to a customer: power distribution, cooling, racks, buildings, EPC, and interconnection work. Different companies structure this differently, which is why their MW costs diverge.
CIFR: colocation developer model
CIFR guided to $9–11M per MW for AI-ready colocation. This reflects a developer-style approach focused on:
standardized construction
optimized cooling for high-density workloads
efficient power design
rapid build cycles
This is not a hyperscaler-grade facility but an optimized infrastructure product for AI tenants who prioritize speed and cost efficiency.
Tyler Page, Chief Executive Officer, Cypher Mining:
What we would do, I guess I’d say in the interim, would be we’ll be deploying the capex for the minimum requirements at the site. Fiber, substation, land, water sourcing, etc. I would say I expect our build cost to be in line with what we’ve done at other sites if we are building the same co-location type access, which has generally been, call it, $9 million-$11 million for critical IT megawatt.
IREN: hyperscaler-grade infrastructure
For Horizon, the Microsoft project, IREN disclosed $14–16M per MW. This higher level reflects:
hyperscaler-level redundancy and reliability
IREN’s custom power and cooling architecture for dense GPU clusters
full EPC scope, including substation, liquid cooling readiness, and compliance with Microsoft standards
This is not IREN’s general CapEx but specifically the cost of a premium MW built for hyperscaler workloads.
Contracted power: the demand signal
Satya Nadella, Microsoft CEO:
“The biggest issue we are now having is not a compute glut, but power — the ability to get the builds done fast enough close to power.”
In NeoCloud, power is the strategic bottleneck. GPUs scale fast, but grid infrastructure does not. Whoever controls power capacity controls future compute, pricing leverage, and the ability to capture hyperscaler demand.
Morgan Stanley recently highlighted this explicitly, projecting a 47 GW shortage of AI-ready power over the next several years. That gap defines the entire competitive landscape: supply is scarce, demand is exploding, and companies with secured power become structurally advantaged.
Here is how the leading players in the space position themselves today:
IREN — ~3 GW of secured power.
Secured power means legally locked-in access to capacity. It is the strongest possible signal that the company can scale without depending on future grid allocations. This is a true strategic asset, not a projection.Cipher Mining — 3.2 GW pipeline including giant Colchis cluster.
CIFR is positioned as a developer-led model inside this ecosystem: they build AI-ready capacity rapidly and cost-efficiently, monetizing it through colocation and hyperscaler partnerships. Their power access forms a cornerstone of this regional pipeline.Nebius— targeting ~2.5 GW next year.
This is expansion intent, not secured capacity. It shows ambition and growth appetite, but it still depends on future grid approvals and partnerships. Nevertheless, it signals the scale at which the company wants to participate in the NeoCloud build-out.
Why investors focus heavily on these numbers
In a market facing a 47 GW projected shortage, the hierarchy is simple:
Secured power = guaranteed ability to scale
Pipeline power = future optionality, depending on execution
Ambition without power = narrative risk
Power access determines who will actually deliver compute over the next decade. It is the bridge between CapEx and revenue, and in many cases, it becomes the ultimate moat.
Final takeaway
The NeoCloud model looks complicated from the outside, but the core signals are simple.
Watch how companies turn power into capacity, how capacity becomes contracted demand, and how demand eventually shows up in revenue. ARR tells you the pace. MW cost tells you the investment. Secured power tells you who can actually scale.
In a market facing a structural power shortage, these fundamentals matter more than any single quarter.
This publication is for educational and informational purposes only and does not constitute financial, investment, or trading advice. Readers are solely responsible for their own investment decisions. The author may hold positions in the securities mentioned.